

Who Pays When Crude Goes Up?
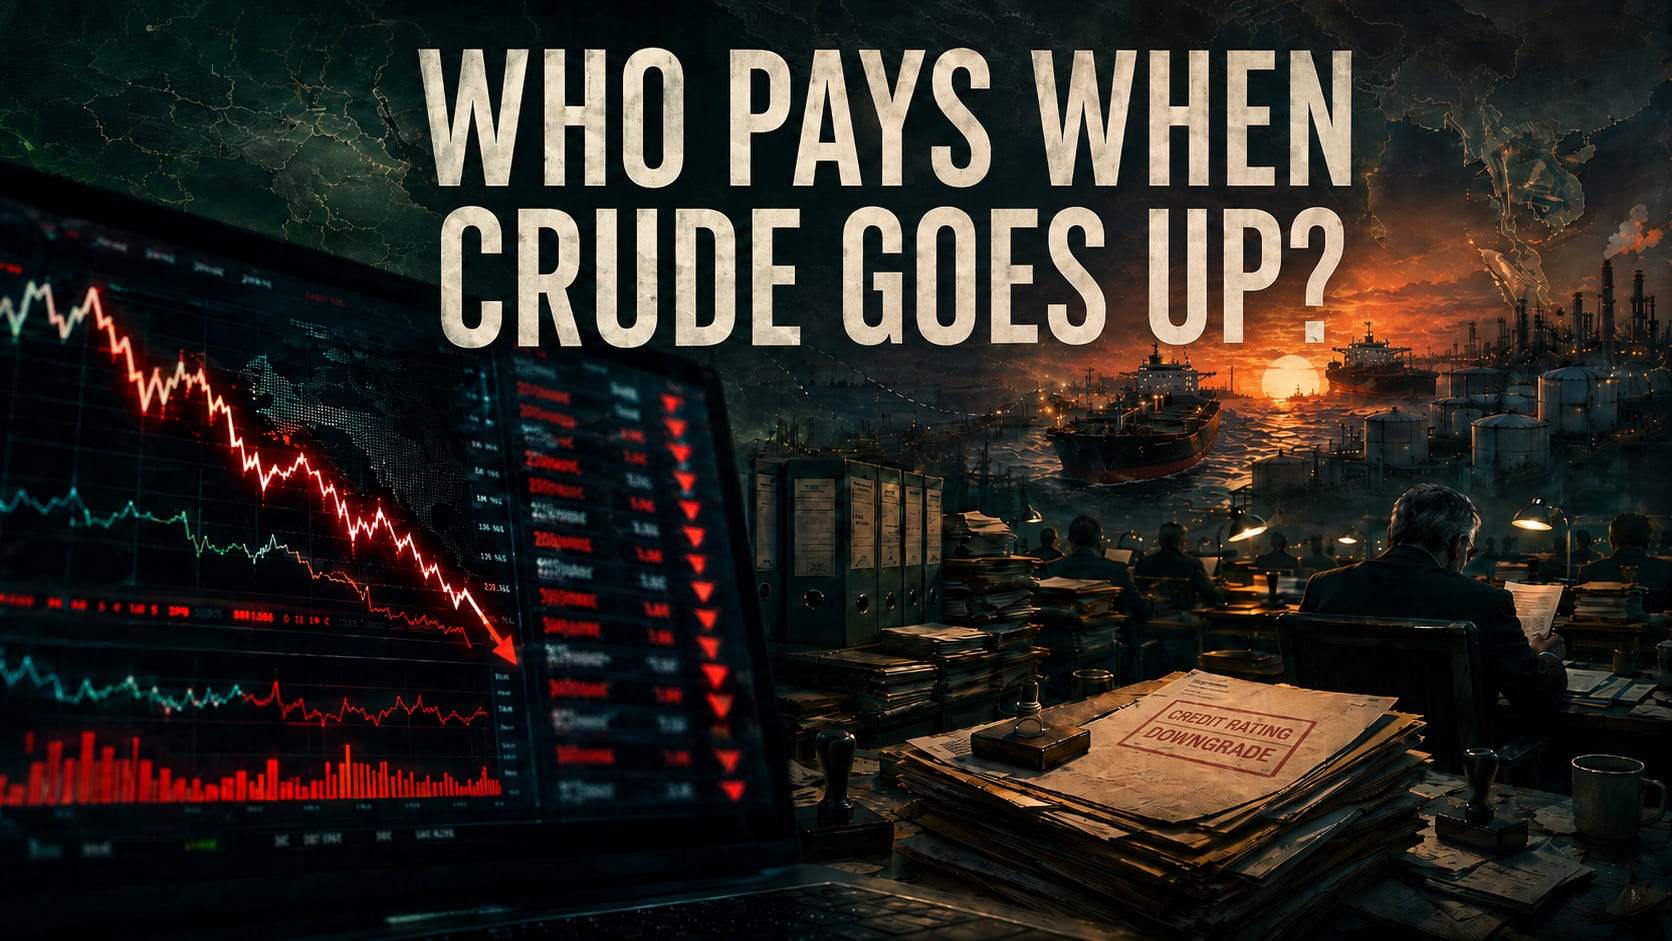
The first wave was oil. The second wave was rates. The third wave is in the country tier — and the FX screen is showing it before the credit ratings do.

Things to know
1. The FX screen is the leading indicator.
The Indian rupee touched an all-time low of 96.96 on May 20. The Philippine peso is the worst-performing currency in Asia since the war began. The Turkish lira has weakened toward 45.9. The Pakistani rupee is rangebound only because the IMF is in the room. The Australian dollar fell sharply at the war’s onset before recovering to multi-year highs as Australia’s energy-exporter status reasserted itself. The Egyptian pound is under managed pressure. Different countries. Same shock. Different transmission channels.
2. The fragile cohort is being held together by the IMF.
Pakistan, Sri Lanka, Egypt, and now Bangladesh are all turning to the IMF — either through existing programs or new ones — to absorb the energy shock. The buffers are holding — for now — because of the official sector, not because the underlying balance has improved.
3. The war hits hardest where policy was mid-pivot.
Turkey was two years into rebuilding monetary orthodoxy when the war broke the trajectory. Egypt, Pakistan, and Sri Lanka were all mid-IMF-program when the war hit. Australia had just begun reversing 2025’s cuts. The reform cycles had a plan. The war is testing whether the plan survives.
4. The mid-tier is the dispersion story.
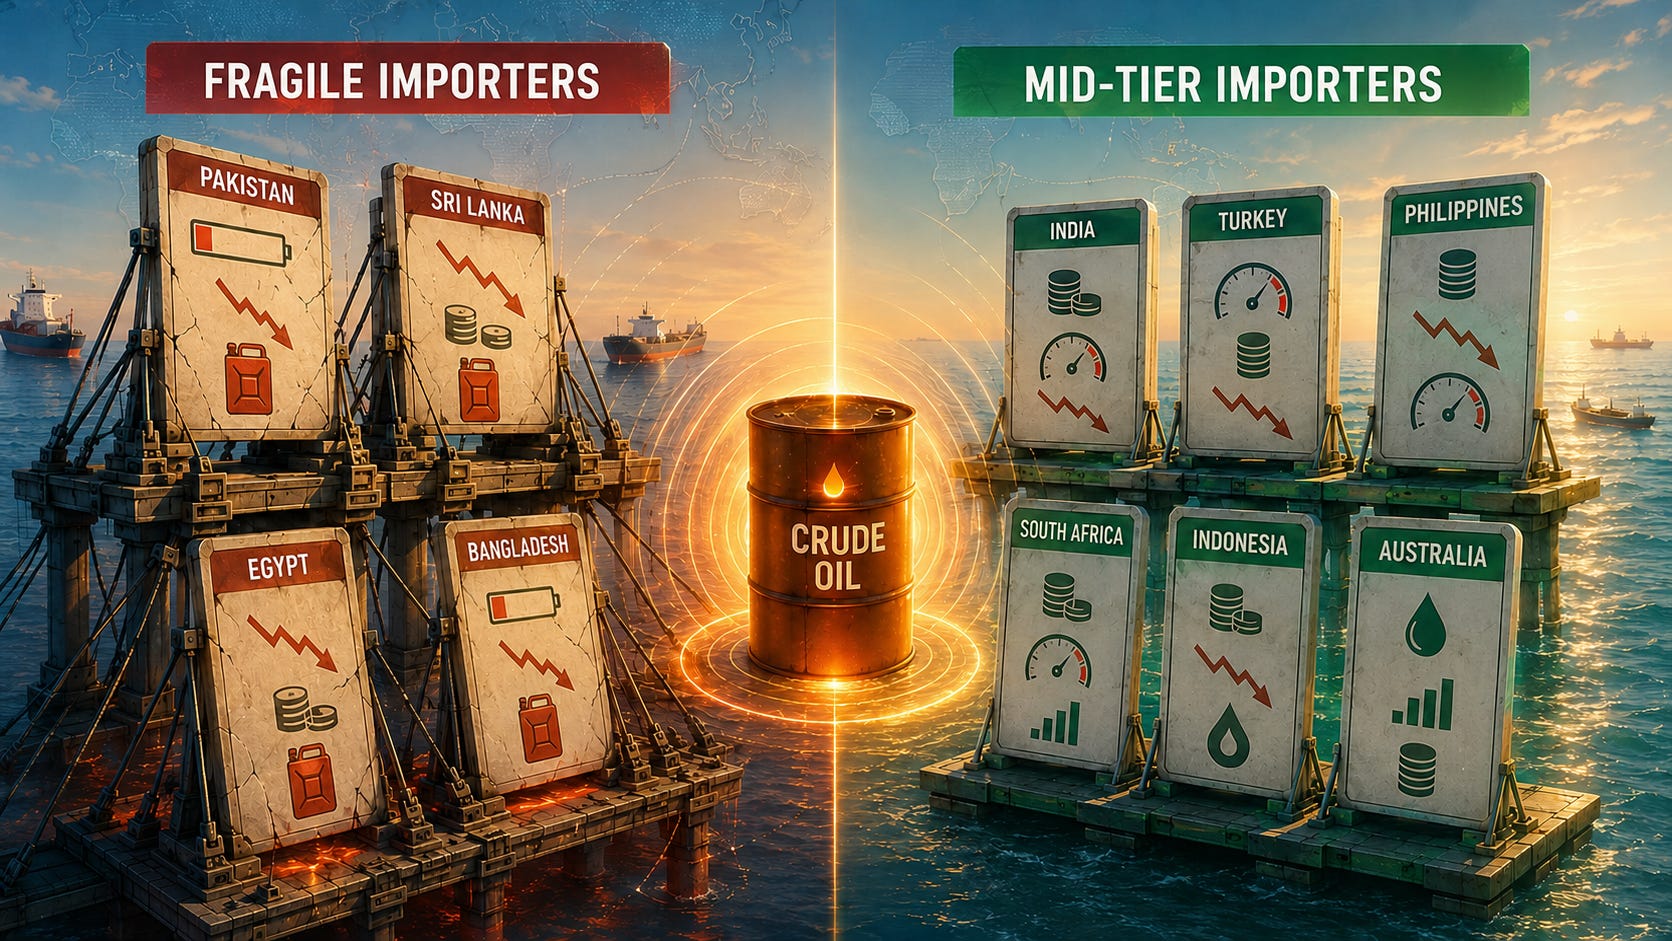
India is absorbing the shock through capital outflows and FX intervention. Turkey is burning reserves. Philippines is running rate hikes against a structural energy-import shock. South Africa is partially offset by commodity exports. Indonesia’s outlook was cut before the war for governance reasons — the war is now compounding. Australia is tightening into a slowing economy. Same crisis, different transmission channels.
5. The beneficiaries are quietly capturing the redistribution.
Nigeria, Angola, Brazil, Guyana, US shale, and Canada are absorbing the volumes that would have moved through Hormuz. Brent remains in the low-to-mid $90s — still meaningfully above the pre-war baseline. The fiscal and current-account benefits are real and accruing.
6. The rating agencies have not caught up.
Egypt was affirmed by Moody’s at Caa1 with Positive outlook in April 2026 — during the war. Fitch affirmed Pakistan’s B- with Stable Outlook in April, explicitly citing Pakistan’s ceasefire-broker diplomatic role as a positive offset. India’s Moody’s review held Baa3 Stable. Australia remains AAA. Across the importer cohort, no actual rating downgrades since the war began. But agencies have moved on outlooks: Fitch revised Turkey’s outlook back to Stable in April after $50bn in reserve sales, and Moody’s and Fitch cut Indonesia’s outlook to Negative — though Indonesia’s cuts were largely for pre-existing governance reasons rather than the war itself. The pattern: agencies acknowledging stress through outlook revisions, but the ratings themselves still holding.
The third wave is in country balance sheets. The FX screen is the leading indicator. The credit ratings haven’t followed yet.
The fragile cohort is being held together by the IMF
Four countries in the fragile cohort are turning to the IMF — through existing programs, new requests, or both — to prevent balance-of-payments crises that the FX moves would otherwise be signaling.
Pakistan. The Pakistani rupee sits in a managed band only because of IMF support. The IMF approved the latest disbursement on May 8 — roughly $1.1 billion under the Extended Fund Facility and $220 million under the Resilience and Sustainability Facility. Pakistan’s reserve cover remains thin — around 2.5 months of imports on IMF projections — even with reserves being rebuilt under the program. Fuel rationing has not been formally announced but is rolling through power generation. Fitch affirmed Pakistan’s B- rating with Stable Outlook on April 13, 2026. Notably, the agency explicitly cited Pakistan’s role as a ceasefire broker as a “tangible benefit” that may partly offset external pressures. The agency found ways to be positive about a country whose currency is rangebound only because of the IMF, while the war is on.
Sri Lanka. The Sri Lankan IMF program is in its third year — the IMF completed the fifth and sixth EFF reviews in late May, making roughly $695 million available. Fuel rationing returned in late March as energy costs surged. Headline reserve cover is around three-to-four months, but the usable buffer remains thin. The economy that nearly collapsed in 2022 is being held together by the IMF and remittance flows — the latter materially exposed to Gulf labor markets.
Egypt. The Egyptian IMF program was expanded to $8 billion in 2024 and is the binding constraint on macroeconomic policy. Net international reserves stood at $53 billion at end-April. Remittances reached $29.4 billion in the first eight months of FY2025/26, up 28% YoY. Moody’s affirmed Egypt’s Caa1 rating with a Positive outlook in April 2026 — during the war — citing exchange-rate flexibility and policy credibility. Egypt is the case study in managing currency pressure with discipline rather than denial. Fitch in April cited exactly this discipline as the reason the B Stable rating held. It is also the cleanest single illustration of agencies holding fast while market stress builds.
Bangladesh. The fastest-moving fragile case in the article. Bangladesh relies on imports for roughly 95% of its energy needs, including imported LNG for power generation and industrial use. Bangladesh’s spot LNG procurement costs jumped from roughly $10/mmBtu in January to a reported $28.28/mmBtu March cargo. The government has shut down four of five state-run fertilizer plants, restricted diesel sales, conserved gas, and closed universities to preserve power. On June 3, the IMF officially confirmed Bangladesh had requested a new financial arrangement — on top of the existing $4.7 billion 2023 IMF-supported program — to manage the energy import shock. Bangladesh is seeking over $2 billion in combined financing from the IMF, ADB, World Bank, and the Islamic Trade Finance Corporation. The World Bank approved $350 million in additional financing in mid-May. Bangladesh is the case study showing how fast an import-dependent economy can move from “managing” to “requesting” when the energy shock hits.
The fragile cohort is the import-dependent cluster where the question is not whether the buffers will hold but whether the official sector will continue to provide them.
The mid-tier is the dispersion story
The mid-tier is where the dispersion is widest. Large economies, all under real stress, each absorbing the shock through different channels.
India. The rupee touched 96.96 on May 20 — an all-time low — extending a 6% decline since the war began. Three interlocking forces are driving the move. First, the oil shock: India is one of the world’s largest net crude importers, and the April trade deficit widened to $28.4 billion. Second, capital outflows: foreign portfolio investors have pulled out more than $20 billion from Indian equities since late February — the sharpest sustained outflow since the COVID-era shock of March 2020. Third, the rates channel: rising US Treasury yields are making dollar assets more attractive on a risk-adjusted basis. The RBI is actively defending the currency through state-run banks. Forecasts have shifted toward the mid-to-high 90s for the remainder of 2026. India’s macro fundamentals remain strong — S&P upgraded India to BBB Stable in August 2025 — but the price action says the market is testing those fundamentals harder than the agencies are. The rupee partially recovered to 94.95 after RBI and government intervention on June 5, and remains volatile. The FX screen is not directionally settled.
Turkey. Turkey is the case study in war hitting hardest where policy was mid-pivot. The CBRT had spent two years rebuilding orthodoxy — policy rate at 37%, inflation down from a 75% peak in 2024, disinflation path credible, lira depreciation running at roughly 15–20% annually under the tightening cycle. The Iran war broke the trajectory. Borsa Istanbul fell 7% in the opening on March 2. The central bank sold more than $50 billion in foreign currency to support the lira since the war began. The lira weakened through the mid-44s in early April and toward 45.9 by late May. The CBRT paused its easing cycle explicitly because of the war. Turkey is heavily dependent on imported energy — net energy imports run 3.5–4.5% of GDP at $60–65 billion annually, before the price shock. Iran supplied 14% of Turkey’s natural gas imports before strikes on South Pars disrupted flows. Fitch responded on April 10 — revising the outlook from Positive to Stable, citing the $50bn in reserve sales and rising risks from the conflict. The rating itself was affirmed at BB-. Turkey is the case where agencies have moved on the outlook — acknowledging the stress — without yet moving on the rating. The market is testing whether that distinction holds.
Philippines. The peso is the worst-performing currency in Asia since the war began per MUFG — down 6.6% against the dollar since late February. The peso hit a record low of 60.69 on March 30. The Philippines gets roughly 98% of its crude oil imports from Middle East suppliers, the bulk transiting Hormuz. President Marcos declared a national energy emergency on March 24 and signed Executive Order 110 granting authority over fuel rationing. Diesel prices more than doubled in the early weeks of the war. The BSP raised its policy rate by 25 basis points to 4.5% in mid-April — its first hike since the previous tightening cycle ended — with analysts expecting cumulative 75 basis points of hikes for the year. Q1 GDP slowed to 2.8% — a post-pandemic low. The ADB offered $1.75 billion in funding support in mid-May. Sovereign credit remains BBB+ stable. The Philippines is the cleanest Hormuz-importer stress story in the article: 98% crude oil dependence on Middle East suppliers, a peso that started weakening the week the war began, and a central bank running into the shock with the policy rate.
South Africa. The rand swung between 16.6 and 17.2 against the dollar over March before stabilizing around 16.7. The dispersion story here is different. South Africa is a commodity exporter — gold, platinum, coal — and the same crisis that drives oil prices higher also drives precious-metals prices higher. The net effect is partially offset relative to pure importers. The SARB moved from a cuts discussion to an actual hike, taking the repo rate to 7.0% on May 28. South Africa has thin strategic fuel reserves and limited fiscal room to subsidize, but the commodity mix provides a natural hedge. South Africa is the example of why the mid-tier dispersion is wide — the same shock produces meaningfully different outcomes depending on what a country exports alongside what it imports.
Indonesia. Moody’s cut Indonesia’s outlook to Negative on February 6 — three weeks before the war began — citing reduced policy predictability under President Prabowo, fiscal concerns over the Free Nutritious Meals program, and centralization of policymaking authority. Fitch followed on March 4, citing similar policy uncertainty rather than the war directly. These were among the most significant negative rating moves on Indonesia in recent memory. The war is now compounding the underlying concerns without triggering additional action. The rupiah weakened toward IDR 17,000 in March — a multi-year low. Headline inflation jumped to 4.76% in February, breaching Bank Indonesia’s 1.5-3.5% target ceiling. The 3% budget deficit cap is under pressure from elevated oil costs. Bank Indonesia introduced new measures on April 1 to curb rupiah speculation. Indonesia is the case where agencies acted on the outlook — but acted before the war for non-war reasons. The Baa2/BBB ratings themselves were affirmed. Whether the war now forces a rating notch downgrade is the open question.
Australia. Australia is not a fragile importer — it is a net energy exporter whose currency recovered to multi-year highs near $0.7270 by May as that status reasserted itself. But fuel-price pass-through has been real: the RBA has hiked three times in 2026 to 4.35% — reversing nearly all of 2025’s cuts. CPI rose to 4.6% in March from 3.7% the prior month, well above the 2-3% target. The AGS 10-year yield touched near 5% — a multi-year high. The Treasurer told parliament the Australian economy is “hostage” to the US-Iran conflict. Bond markets are pricing potential further hikes to 4.75% by year-end. Australia is the case study showing the importer hierarchy spans developed and emerging markets alike — a country that benefits and suffers from the same shock through different channels. AAA-rated. Not AAA-insulated.
The beneficiaries are quietly capturing the redistribution
The flip side of the importer story is the exporter story. As of early June, Brent was trading below but close to $100 — down from above $100 at peak but still well above the pre-war baseline. The producers exporting outside Hormuz are absorbing both the price benefit and the volume substitution.
Nigeria and Angola. Both are Brent-linked exporters. Nigerian oil revenues are running above the budget benchmark — Brent has traded well above the $64/barrel assumption embedded in the 2026 budget. Angola’s terms of trade have improved materially on higher Brent. Angola has not yet seen a rating upgrade. Nigeria is already the exception — S&P upgraded it to B in May 2026, showing exporter credits can move when oil upside overlaps with improving policy credibility. Importer-side rating notches have held.
Brazil and Guyana. Both are among the most important Atlantic-basin sources of incremental non-OPEC supply — production from Brazil’s pre-salt fields and Guyana’s Stabroek block is accelerating into the gap left by constrained Middle East flows. Capex cycles are extending. Brazil’s external accounts are receiving a meaningful boost.
US shale. US shale remains one of the key non-Hormuz supply offsets. The Permian is the swing supplier of the redistribution.
Canada. The most distinctive beneficiary in this group. Canadian heavy crude fills a gap for refiners that have historically sourced heavy grades from the Middle East. The Trans Mountain Expansion pipeline — operational since May 2024 — gave Alberta heavy crude access to Pacific tidewater for the first time. TMX cargoes to Asia have been running near capacity since the war began — Trans Mountain’s CEO told CERAWeek in March that utilization was in the “high-90s” and directly attributed the surge to Middle East supply disruption. The Canadian dollar has been one of the top-performing G10 currencies since the conflict began — ING called it the best-performing G10 currency. Canadian energy equities are the index tailwind. The politics of additional pipeline capacity have re-entered the conversation — war typically accelerates infrastructure decisions, and Canada is the live case.
The beneficiaries are accruing fiscal and current-account benefits that are real, dated, and accelerating. Rating notches have held — but agencies are moving first through outlooks, and exporter-side exceptions are beginning to appear.
What would prove this view wrong
The Hormuz crisis is repricing country balance sheets — and it is showing up in FX markets first. The fragile cohort is being held together by the IMF. Across the mid-tier, each country is absorbing the shock through a different channel. The beneficiaries are accruing quietly. Importer-side ratings have held throughout.
The following developments would falsify this view.
The currencies of the fragile and mid-tier importers return materially toward their pre-war levels and hold there for 30 days — demonstrating the FX screen was pricing a transient shock, not a structural one.
Brent returns below $80 and stays there.
Fitch or Moody’s issues fresh positive rating actions on at least two stressed importer credits after publication — upgrades or outlook improvements explicitly citing durable policy response despite the war. (Pakistan, Egypt, Philippines, Indonesia, South Africa, Sri Lanka, Bangladesh.)
Australia’s RBA pauses or reverses the tightening cycle.
None of these have happened. The FX screen remains volatile — record lows followed by intervention-driven recoveries, but no sustained reversal. The agencies keep holding on the importer side. The beneficiaries keep accruing.
The FX screen is the leading indicator. The rating agencies are the lagging one.
So oil goes up , rates go up and balance sheet stress goes up