

Second Wave. Different Barrel.
The first wave was oil. The second wave is rates. The cross-asset map has split — and the dispersion within it tells you where the next move is.

Five things to know
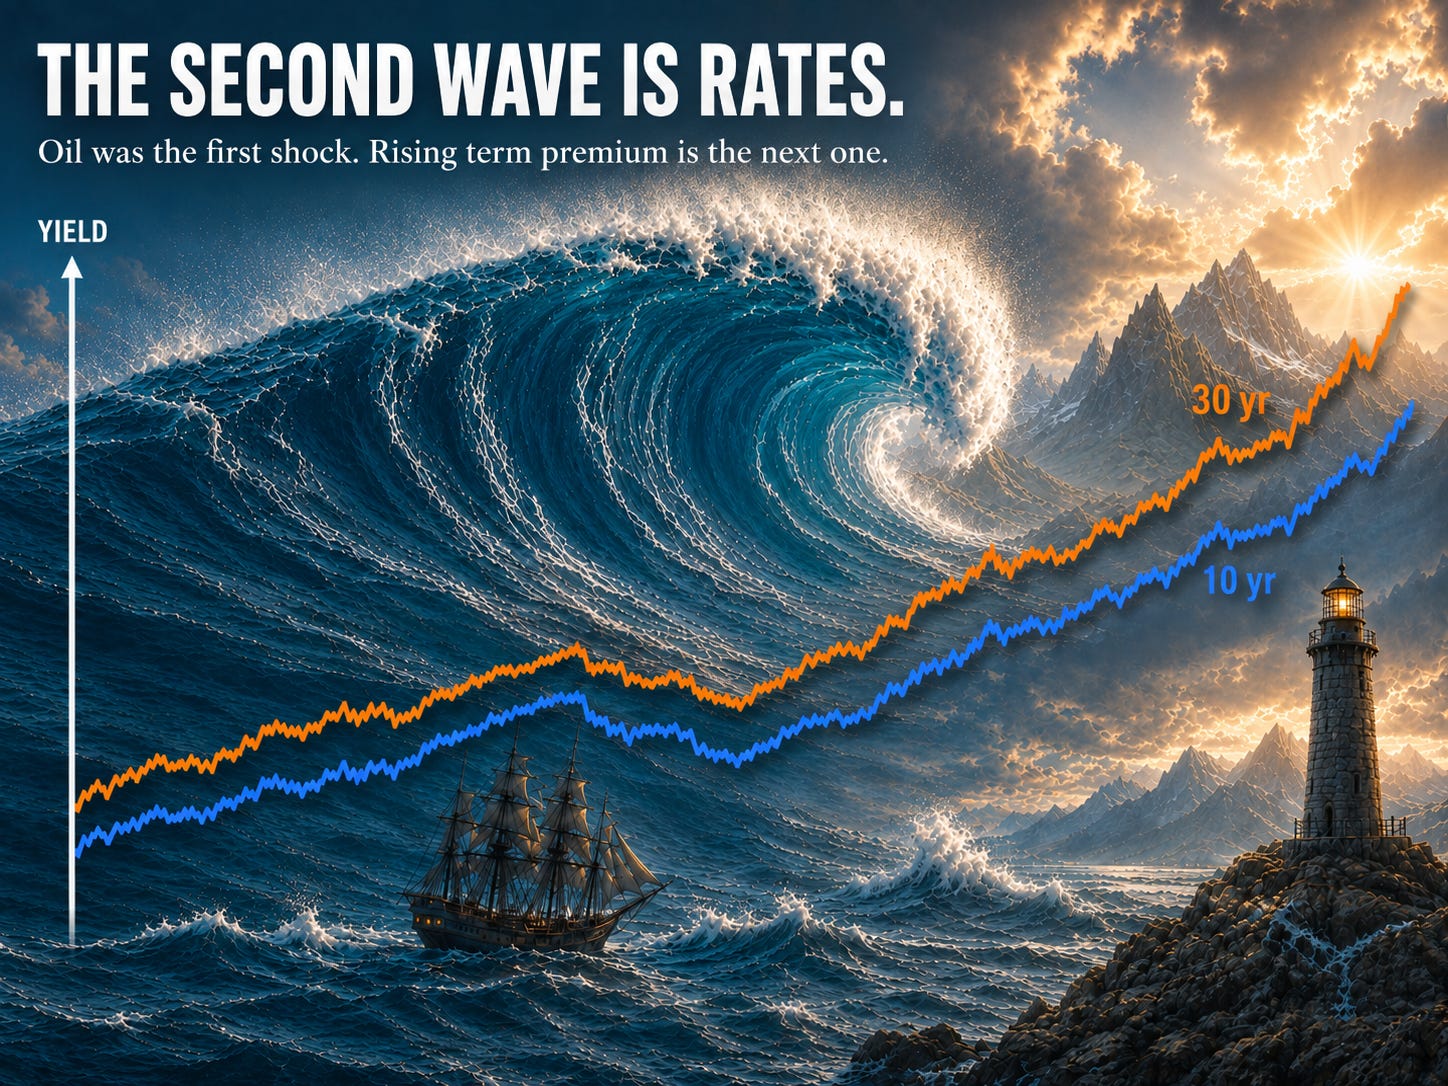
1. The bond market is pricing a hike cycle, not a cut cycle deferred.
The 30-year US Treasury touched 5.20% intraday on May 19 — an 18-year high — and eased to 4.99% on May 29 as MOU talks pulled Brent down to $91. The 10-year peaked at 4.68% on May 19 and closed May 29 at 4.45%, against a 3.97% pre-war baseline. The whole curve has shifted up, with the 30-year at post-2007 stress levels — a term-premium move, not a recession one. Hormuz has reset what “transitory” means.
2. Four central banks. Same direction.
The Fed split 8 to 4 on April 28–29 — largest dissent since October 1992. The ECB is pricing better than 80% odds of a June hike. The BoE — at 3.75% — has one quarter-point hike fully priced for November with roughly a one-in-three chance of a second, pricing pulled back as MOU talks advanced. The Bank of Japan has a board member urging the next hike “as soon as possible.” Different banks, same conclusion.
3. Capital is reorganizing, not fleeing.
S&P 500 Energy was up 39% in Q1 — a record 14-week winning streak. Stoxx 600 Travel & Leisure went peak-to-trough −15.6%. Tadawul (Saudi Arabia) is flat to slightly positive since the war started. Dubai DFM is down roughly 14%. Cumulative UAE market cap loss roughly $120 billion. The dispersion is the signal.
4. Saudi is the swing variable.
The kingdom posted its largest quarterly deficit ever recorded — SAR 125.7 billion ($33.5 billion) in Q1, eating 76% of the full-year forecast in 90 days. Production has fallen from roughly 10 mb/d pre-war to below 7 mb/d by April — a 30%+ collapse at the precise moment oil prices should have been most supportive. PIF has pivoted strategy from “rapid acceleration” to “value creation.” Riyadh appears to have declined to host the US escort operation. Saudi institutions recorded roughly SAR 7.26 billion ($1.9 billion) in net buying on the Tadawul in March, while foreign investors were marginal net sellers. Swing producer. Swing political actor. Regional safe-haven. Simultaneously.
5. The dispersion is the architecture.
The bond market says higher for longer. The equity dispersion says capital is reorganizing within the region, not fleeing it. The Saudi profile says the swing producer is also the swing political actor. Each instrument tells you something different about where the next move is — and where you sit on that map determines whether the second wave is a tailwind or a drag.
The first wave was oil. The second wave is rates. The third wave will be in country balance sheets — that comes in Part 3.
The bond market is the cleanest evidence
Equities can be wrong about geopolitics for months. The bond market usually figures it out in weeks.
The 10-year US Treasury went into this war at 3.97%. It peaked at 4.68% on May 19 and closed May 29 at 4.45%. The 30-year touched 5.20% intraday on May 19 — highest since July 2007 — and closed May 29 at 4.99%, having eased as Brent fell from above $100 to $91 on MOU talks. The May 28 PCE release came in below expectations — headline 3.8%, core 3.3% — pulling yields lower. The whole curve has shifted up since the war began, but the 30-year sits at post-2007 stress levels, giving the move a term-premium character — investors are demanding more compensation for long-dated inflation risk, not pricing a recession. The partial retreat from peak is exactly the first-layer unwind a credible de-escalation should produce.
The German Bund 10-year sits at 2.96% on May 29 — off recent 15-year highs above 3.20% as ceasefire talks pulled yields lower. The UK Gilt 10-year is at 5.07%. The Japanese 10-year JGB at 2.77–2.80% — the highest since September 1996. That last number is the regime change. The JGB has not traded at these levels since the Hashimoto government.
Four central banks. Four different starting positions. Same direction.
The Fed split 8 to 4 on April 28–29 — the largest dissent since October 1992. Powell’s term ended May 15. Kevin Warsh took over a Committee fractured between regional presidents resisting any easing bias and a Trump appointee dissenting for cuts. The new Chair inherits a meeting cadence that does not start clean. The ECB has gone from “cutting in March” to pricing a 25 bp hike at the next meeting. The BoE — with Bank Rate at 3.75% — has one quarter-point hike fully priced for November with roughly a one-in-three chance of a second, pricing pulled back as MOU talks advanced. A BoJ board member is publicly urging the next hike “as soon as possible.”
The market is no longer pricing a system that is about to normalize. It is pricing a system that has changed.
The equity dispersion is the second tell
Equities are the slower instrument. The story they are now telling is dispersion.
S&P 500 Energy ended Q1 at +39% — a record 14-week winning streak per Bloomberg. The broad S&P 500 wiped out its YTD gains by late March, recovered above 7,000 by mid-April, and has been selling off again on the yields move. The Nikkei hit a record 65,408.87 intraday on May 25 and closed above 66,000 on May 29 as ceasefire optimism drove a tech-led rally. Japan’s equities are pricing the yen-weakness boost from rates divergence. Stoxx 600 Travel & Leisure traversed a peak-to-trough drawdown of 15.6%.
The energy outperformance versus the broad market is the first dispersion. The buy-side is concentrating risk in a single sector while reducing exposure to everything else. That is not a normal cycle position. It is a hedge against the structural argument PSI has been making for six weeks.
The airlines tell a sharper version of the same story. The hedge book is the differentiator. Airlines that locked in fuel at pre-war prices are losing that protection quarter by quarter. The bifurcation is now visible in the price action: hedged Asian and US flag carriers trading at one valuation; unhedged European and Middle East carriers at another. The MSCI ACWI Airlines index has been down through March and April even as broad equities recovered. The June IATA meeting is where the industry will be forced to test its 2026 outlook — the original guidance assumed $86 jet fuel; the market is now at $162.
The regional dispersion is the most striking. Tadawul, the Saudi index, is flat to slightly positive against its February 25 entry close of 10,847.93 — closing at 11,027 on May 21. Dubai DFM has fallen roughly 14% from pre-war levels. Abu Dhabi is down roughly 9%. Cumulative UAE market cap loss: roughly $120 billion. Qatar and Bahrain are down low single digits. Oman is up.
Capital is not leaving the region. It is reorganizing inside it. Saudi institutions recorded roughly SAR 7.26 billion ($1.9 billion) of net buying on the Tadawul in March, while foreign investors were marginal net sellers. The kingdom’s equity market is functioning as a regional safe-haven. The UAE’s is not. The same crisis is producing opposite outcomes in two adjacent markets.
The dispersion is the signal across all three layers — sector, sub-sector, region. The crisis is not affecting “global equities.” It is producing winners and losers within them. Where you sit on the dispersion map determines whether the second wave is a tailwind or a drag.
Saudi is the swing variable
The kingdom is the only actor in this crisis with the simultaneous fiscal capacity, production flexibility, and political optionality to change the trajectory in any direction.
The fiscal picture cuts both ways. Q1 2026 deficit: SAR 125.7 billion ($33.5 billion) — the largest quarterly deficit ever recorded by the kingdom, consuming 76% of the full-year forecast in 90 days. Bloomberg Economics’ pre-war fiscal breakeven was $94/bbl standard, $111/bbl PIF-inclusive. At sustained $100+ Brent, the revenue side is supported. The expenditure side is widening — Q1 government spending up 20% YoY, military spending up 26%. PIF approved its 2026–2030 strategy on April 15 with a pivot from “rapid acceleration” to “sustained value creation.” Saudi PMI for March printed 48.8 — first contraction since August 2020. The kingdom is consolidating, not expanding.
Production has fallen from roughly 10 mb/d pre-war to below 7 mb/d by April — a 30%+ collapse in the kingdom’s most important export at the precise moment oil prices should have been most supportive. The East-West pipeline hit its full 7 mb/d design capacity on March 28 — first time in its history — as the kingdom rerouted crude to Yanbu on the Red Sea. Throughput has since eased as upstream production has fallen. An Iranian drone strike on April 9 cut pipeline throughput by 700 kb/d for 72 hours. Restored by April 12. The kingdom restoring capacity in 72 hours is not reassuring. It tells you the next strike will be more carefully targeted.
The political position is consistent. Reuters reported on May 12 — citing two Western and two Iranian officials — that Saudi Arabia covertly struck Iranian assets in late March and reduced Iranian attacks on Saudi territory by 76% in one week. The 2023 Beijing-brokered détente is dead. Riyadh rejected the PGSA via the May 5 UN Security Council draft. Riyadh appears to have declined to host Project Freedom.
Bilateral coercion against Iran. Refusal of operational entanglement with the US. Regional safe-haven for capital. That is the same Saudi position viewed through three different lenses.
Saudi is the largest swing producer, the largest swing political actor, and the regional safe-haven for capital simultaneously. That is unusual. These three roles do not sit comfortably together. The moment one of them demands a decision the others cannot accommodate, the configuration breaks. None of them has yet been tested at full pressure simultaneously.
What unwinds — and what doesn’t
The repricing is not uniform. Some of it will reverse on a ceasefire. Some of it is already permanent.
The risk-premium component in Brent — perhaps $10–20/bbl of the current price level — unwinds quickly on de-escalation. The front-end of the curve resets. War-risk insurance pricing eases if no incidents occur for a sustained period. Transport, airlines, autos, and discretionary equities recover some of the sell-off. The marginal terror premium in gold bleeds out. Brent’s drop from above $100 to $91 and the partial yield retreat from peak are exactly this — the first-layer unwind has begun.
The middle layer is stickier. The shadow fleet built to move sanctioned barrels — 1,140 vessels and 127.4 million dwt per BRS — is structurally embedded. Supply-chain capex shifts toward Cape of Good Hope routing, Atlantic Basin LNG, and Brazilian and Guyanese deepwater are already in motion. Insurance market structure — annual Gulf cover removed at the April 1 reinsurance window — takes a sustained no-incident period to rebuild.
The bottom layer does not unwind. The UAE OPEC exit is institutional. The PGSA precedent — an administrative toll on an international waterway — does not disappear with a ceasefire. The Saudi-Iran détente is finished. Central bank credibility on transitory inflation is gone for at least one cycle. The Fed’s 8–4 dissent does not unprint. The PIF strategy pivot from acceleration to value creation does not reverse.
The market is currently pricing the first layer. It is under-pricing the second. It has not started pricing the third.
What would prove this view wrong
This is testable.
The 10-year US Treasury returns below 4.00% and stays there for 30 days.
The Warsh Fed cuts at the June 16–17 meeting.
Tadawul corrects 10%+ on outflows while DFM rallies — i.e., the dispersion reverses.
Saudi Arabia explicitly endorses and provides operational support for a US-led escort operation.
Brent returns below $80 and stays there.
None of these have happened. The bond market keeps printing higher than its pre-war baseline. The dispersion keeps widening. Saudi keeps operating on its own timetable.
The MOU framework is the cleanest path to invalidating this thesis — a 60-day arrangement with Iran clearing mines from the Strait, full reopening, and the US lifting the naval blockade in synchronized steps. But the framework is contested by both sides. On May 27, the White House denied that the version Iran’s state TV released was the real MOU, calling it “a complete fabrication.” Iran has denied giving final approval to whatever Washington claims is in negotiation. Israel believes Supreme Leader Mojtaba Khamenei has not signed off. On May 29, Trump entered the Situation Room to make a “final determination” and emerged without an announcement; Vance said the two sides were “very close” but “not there yet.”
On the same day, US Naval Forces Central Command issued an advisory establishing a competing transit regime. Vessels are now instructed to coordinate passage with US NCAGS — not Iran’s PGSA. The Joint Maritime Information Center raised the Strait threat level to CRITICAL. The advisory pre-authorizes US force against any vessel observed to be engaged in or supporting mine-laying activities. This is the US response to the PGSA — not a return to the old architecture, but a competing architecture. Two state actors are now running parallel permitting systems for the same waterway, with kinetic enforcement on the US side.
The same week saw US “self-defense strikes” on Iranian missile launch sites and the Bandar Abbas ground control station, four Iranian drones shot down, and an IRGC retaliation on the US airbase that launched the strikes. The MOU is being negotiated against the sound of strikes.
All of the above assumes the kinetic war stays paused. If strikes resume in scale, the rates trajectory hardens further and the dispersion sharpens — not the reverse.
The bond market figured it out first. The equities are still catching up.
What comes next
Part 3 walks the importer hierarchy — the country tier where the pain actually lives. The fragile cohort: Sri Lanka, Bangladesh, Pakistan, Egypt. The mid-tier: India, Turkey, Indonesia, South Africa. The beneficiaries quietly capturing the redistribution: Nigeria, Angola, Gabon, Brazil, Guyana. The rating agencies have not caught up.
Bond market doesn’t lie. 30y at post-2007 highs isn’t a recession signal — it’s a term-premium regime shift. First wave was oil, second wave is rates. PSI laying it out perfectly. The dispersion map is the new edge.